Tribal Casinos See Annual Upward Climb in Non-gaming Revenues
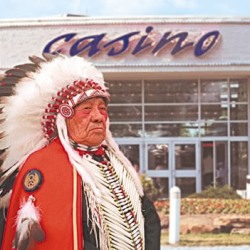
Tribal casinos have increasingly been diversifying their non-gaming products in order to broaden the entertainment side of their businesses and offer their customers a more complete night out. This casino model started over a decade ago in Las Vegas, and has since become an essential focus for both commercial and tribal owned casinos in the US.
The trend has subsequently been reflected in the latest statistics revealed by Alan Meister, CEO of Meister Economic Consulting and author of the Casino City report, which showed tribal gambling reached $31.5 billion in 2016, a 3.9% improvement on the previous year, and marking seven consecutive years of revenue gains. Non-gambling, by contrast, saw its revenue soar by 8.2% from a year ago to hit an all-time high of $4.2 billion.
California
The latest Casino City’s Indian Gaming Industry Report covered 500 tribal casinos across 28 US states, which together offered 359,000 gaming machines and 7,700 table games in 2016. A massive 26.7% of all American Indian casino revenue produced in 2016, however, was accounted for by just one state, California.
In 2016, California’s 74 casinos collected $8.4 billion in gaming revenue, up by 6.3% year-on-year, and giving it a massive 26.7% slice of the market. The non-gaming proportion of that amount then came to $956.9 million, also higher by 6.3% from 2015. Furthermore, Californian tribes have continued to expand their non-gaming operations in a big way and in 2016, the Graton Resort & Casino in the northern part of the state expanded its facility to include a 200-room hotel. Similarly, the Hard Rock International, Caesars Entertainment and Boyd Gaming are currently involved in casino projects with three tribes in the Sacremento area worth more than $1 billion, of which a large chunks is allocated towards expanding their non-gaming offerings.
In the meantime, this year the Pechanga Resort & Casino in Southern California spent $300 million doubling its hotel capacity to nearly 1,100 rooms, whilst adding a plethora of other non-gaming amenities for its guests, such as a luxury spa, two restaurants, and conference room. Commenting upon the development, Pechanga Development Corporation President, Edith Atwood stated:
“We are setting a higher standard of excellence and taking the resort gaming experience in Southern California and beyond to another level.”
Top 5 Casino Markets
Oklahoma is the country’s second biggest tribal casino market with 131 tribal gambling facilities, and in 2016 it saw its revenue rise for the 15th consecutive year, this time by 5% to $4.4 billion. From that tally, non-gambling revenue came to $753 million, representing a huge 14.5% increase versus 2015.
As a result, the Sooner State has carved out a 13.8% share of the market, which combined with that of California means that they together command a 40.5% share of all tribal casino revenue in the US. If revenues from the next three biggest states are added to those of California and Oklahoma, however, the percentage share of the country’s top five tribal casino states then increases to a whopping 63%, with their total revenues in 2016 as follows; Florida ($2.6bn), Washington ($2.5bn) and Arizona ($1.9bn).
Looking at the last state on the list, Arizona’s tribal casino revenue of $1.9 billion in 2016 was down by -0.15% compared to the previous year. By contrast, the state’s tribal casinos saw their non-gaming revenues increase to $328 million last year, representing an impressive +8.6% increase year-on-year. Recently, the Arizona Department of Gaming also reported that tribal casinos paid $94.3 million towards the Arizona Benefits Fund in the fiscal year 2018, up by 4.8% from the $89.8 million collected in fiscal 2017.
Gaming vs Non-Gaming
Compared to most commercial casino markets, revenue derived from non-gaming amenities still represents only a small percentage of tribal casinos’ overall business. Last year, for instance, Nevada gaming accounted for 42.4% of all revenue produced by its casinos, compared to 57.6% for non-gaming products, such as rooms, food and beverage, rising to a 65% share for Las Vegas casinos. Commenting upon the shifting balance, Jennifer Roberts, Associate Director of the International Center for Gaming, stated:
“In Las Vegas, our gambling revenues were declining compared to non-gambling revenues because we were diversifying so much with entertainment and non-gaming amenities. And I think you’re seeing that as well in the tribal communities.”
According to Alan Meister, while tribal gaming originally began on a much smaller scale, including mostly bingo and card rooms, it has since continued to evolve and expand as the industry becomes more diversified. This has been assisted by a greater amount of financing now being made available to businesses in order to help them develop non-gaming facilities that might appeal to a younger demographic less interested in gambling.
Related Articles

NJ Sports Betting Generates Revenue of $24M in September

New Jersey Online Casino Revenue Soars to New Height in September
Maryland Casinos Post Modest 7% Gain in September
Moody’s Optimistic About VIP Spending at Australian Casinos
- Australians Gamblers Wagered $11k Per Person in 2016-17
- UKGC Hits Paddy Power Betfair with £2.2M Fine Over Responsibility Failings
- New Mexico Becomes Latest State to Launch Sports Betting
- NJ Sports Betting Generates Revenue of $24M in September
- Tamir Segal Wins 2018 WSOP Europe COLOSSUS for €203,820
New Jersey Online Casino Revenue Soars to New Height in September

Somerville and Neeme Join Forces to Grow Media Brands

Heather Alcorn Triumphs at 2018 WSOPC Southern Indiana Main Event
Tribal Casinos See Annual Upward Climb in Non-gaming Revenues

